Can Car Transmission Affect Fuel Efficiency?
Disclaimer
The model selection technique employed in this project is a form of stepwise regression. This is a controversial and somewhat naive way of selecting the relevant predictors so the result should be taken with a grain of salt. I do plan to revisit this in the future with some form of cross validation to see if it results in any interesting changes. Of course, the best way to build a model is almost always with proper understanding of the various causal relations pertinent to the subject. Unfortunately I am not well versed in automobile engineering so that is out of my reach.
Synopsis
The relationship between fuel efficiency and car transmission type is studied using the mtcars dataset. A model is built using MLR and regression analysis is carried out. Hypothesis tests suggest that while weight, horsepower and certain number of engine cylinders are significant factors in fuel efficiency, transmission type and having 8-cylinder engine are not.
Introduction
This is an expansion to a project I did for the Regression Models course certificate by Johns Hopkins University on Coursera. You can find the more concise but also more limited original report here in pdf format.
The torque and speed output of an internal combustion engine is controlled using a set of gears. Originally, vehicles require the drivers to manually shift the gears during operation according to the road condition and speed of the vehicle to achieve optimal performance. The advent of automatic transmission allows motor vehicles to automate the gear shifting process without direct human input. Naturally it raises the question, can a competent driver at the helm of a manual transmission car beat an automatic transmission car in terms of fuel efficiency? This report aims to discover the potential effect of transmission type on vehicle fuel economy.
Data Ingress & Preparation
Required libraries and data are loaded using the following code. Motor vehicle road test performance is obtained from the mtcars dataset.
library(dplyr) # for data manipulation
library(ggplot2) # for faceted histograms
library(knitr) # for tables
data(mtcars) # load data needed
The origin of the data can be found on its R documentation page. The included variables are listed in Table 1:
| Description | Categorical | |
|---|---|---|
| am | Transmission (0 = automatic, 1 = manual) | Yes |
| cyl | Number of cylinders (4, 6, or 8) | Yes |
| vs | V or Straight Engine (0 for v, 1 for s) | Yes |
| gear | Number of forward gears (3, 4 or 5) | Yes |
| carb | Number of carburetors (1, 2, 3, 4, 6 or 8) | Yes |
| mpg | Miles/(US) gallon | No |
| disp | Displacement (cubic inches) | No |
| hp | Gross horsepower (hp) | No |
| wt | Weight (1000 lbs) | No |
| qsec | 1/4 mile time (sec) | No |
| drat | Rear Axle Ratio | No |
The outcome variable of primary interest is mpg which measures fuel efficiency. The predictor of interest is am, which categorizes transmission type. However other variables may or may not have an effect on fuel efficiency as well.
To allow logical interpretations during regression analysis, the potential non-categorical predictors are centered and categorical predictors are converted to multi-level factors with the following code:
mtcars <- mutate(mtcars,
                 amf = factor(am, labels = c('auto', 'manual')),
                 cylf = factor(cyl),
                 vsf = factor(vs, labels = c('v', 's')),
                 gearf = factor(gear),
                 carbf = factor(carb),
                 hpc = (hp - mean(hp)),
                 wtc = (wt - mean(wt)),
                 dratc = (drat - mean(drat)),
                 dispc = (disp - mean(disp)),
                 qsec = (qsec - mean(qsec))
                 )
Exploratory Data Analysis
Boxplot of MPG values of all cars grouped by transmission type is shown in Figure 1.
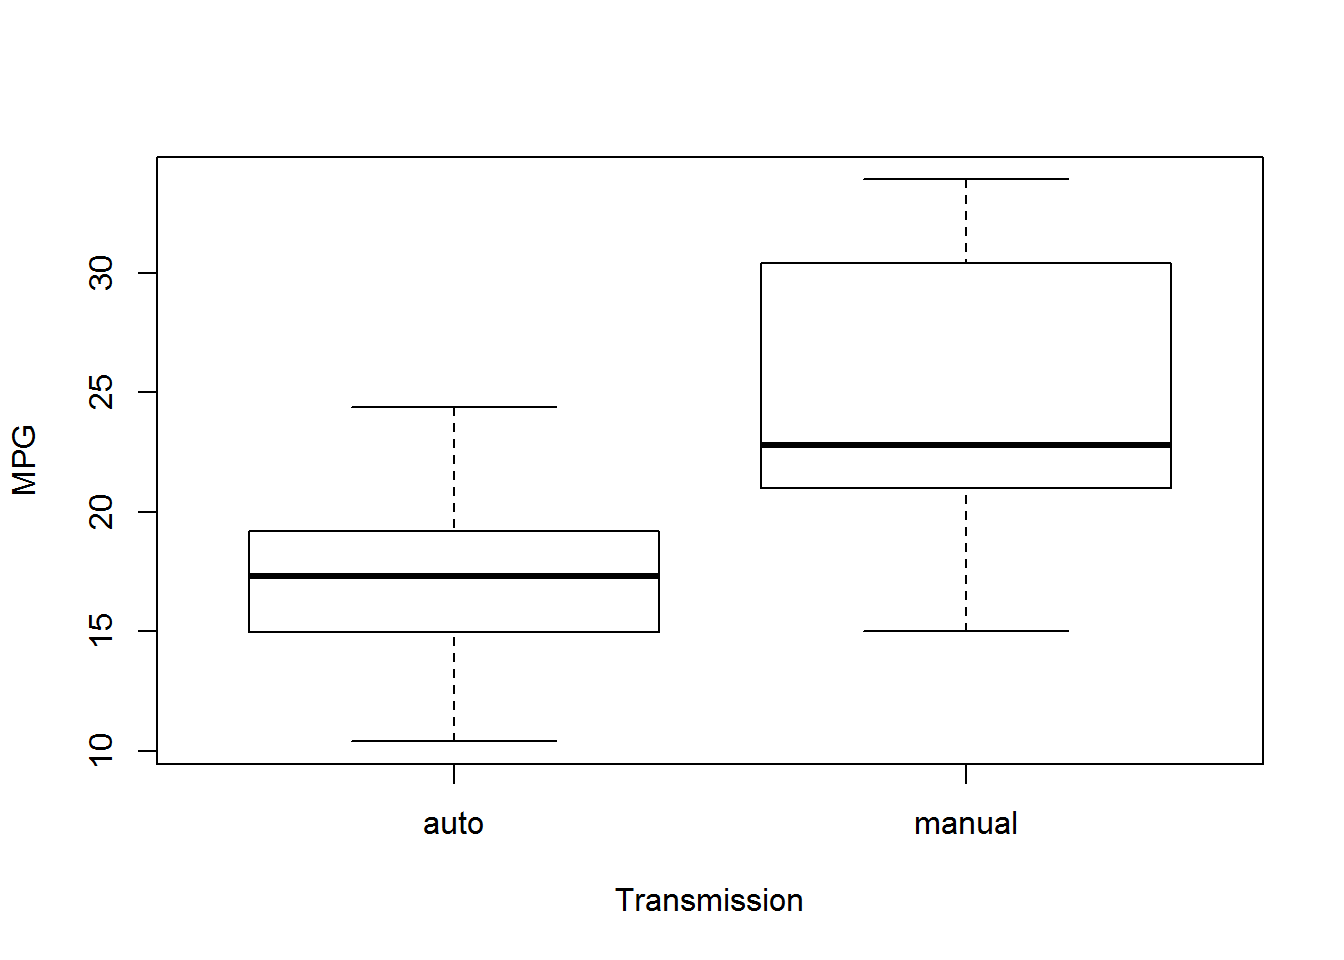
Figure 1: MPG vs Transmission
Judging by this alone it seems to suggest that cars with manual transmission achieves higher fuel efficiency compared to cars with automatic transmission. Boxplots showing MPG vs transmission type colored by the other categorical predictors are shown in Figure 2.
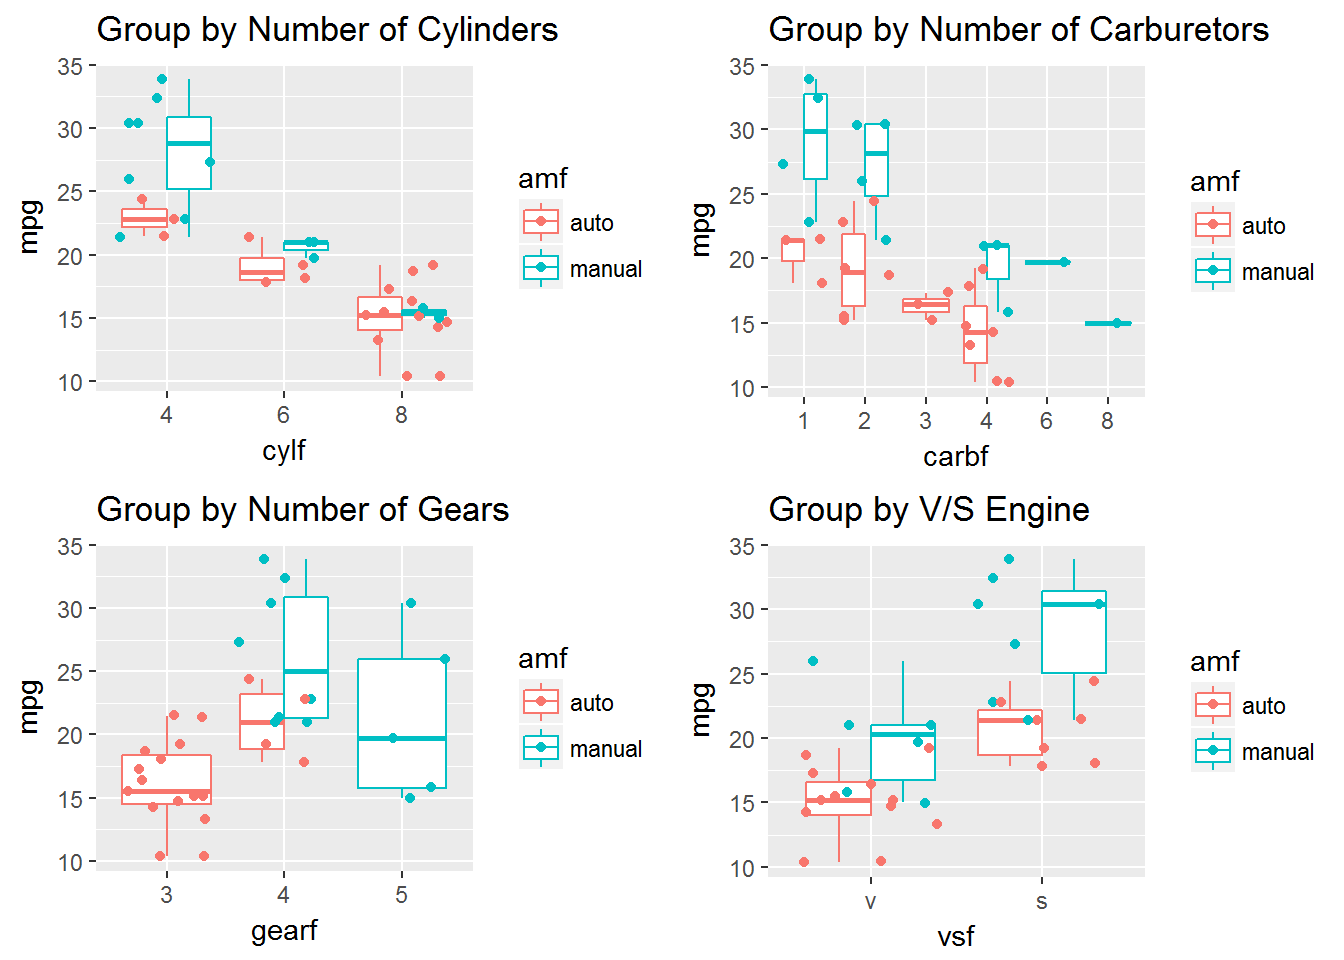
Figure 2: MPG vs Categorical Variables
It can be seen that
- Although there are cases where no data exists for one of the transmission types, manual transmission generally results in higher mpg.
- Number of cylinders, number of carburetors, and V/S engine type are categorical variables that seem to have an effect on mpg. The effect of gears is not as clear.
Figure 3 shows the effect of non-categorical variables on MPG:
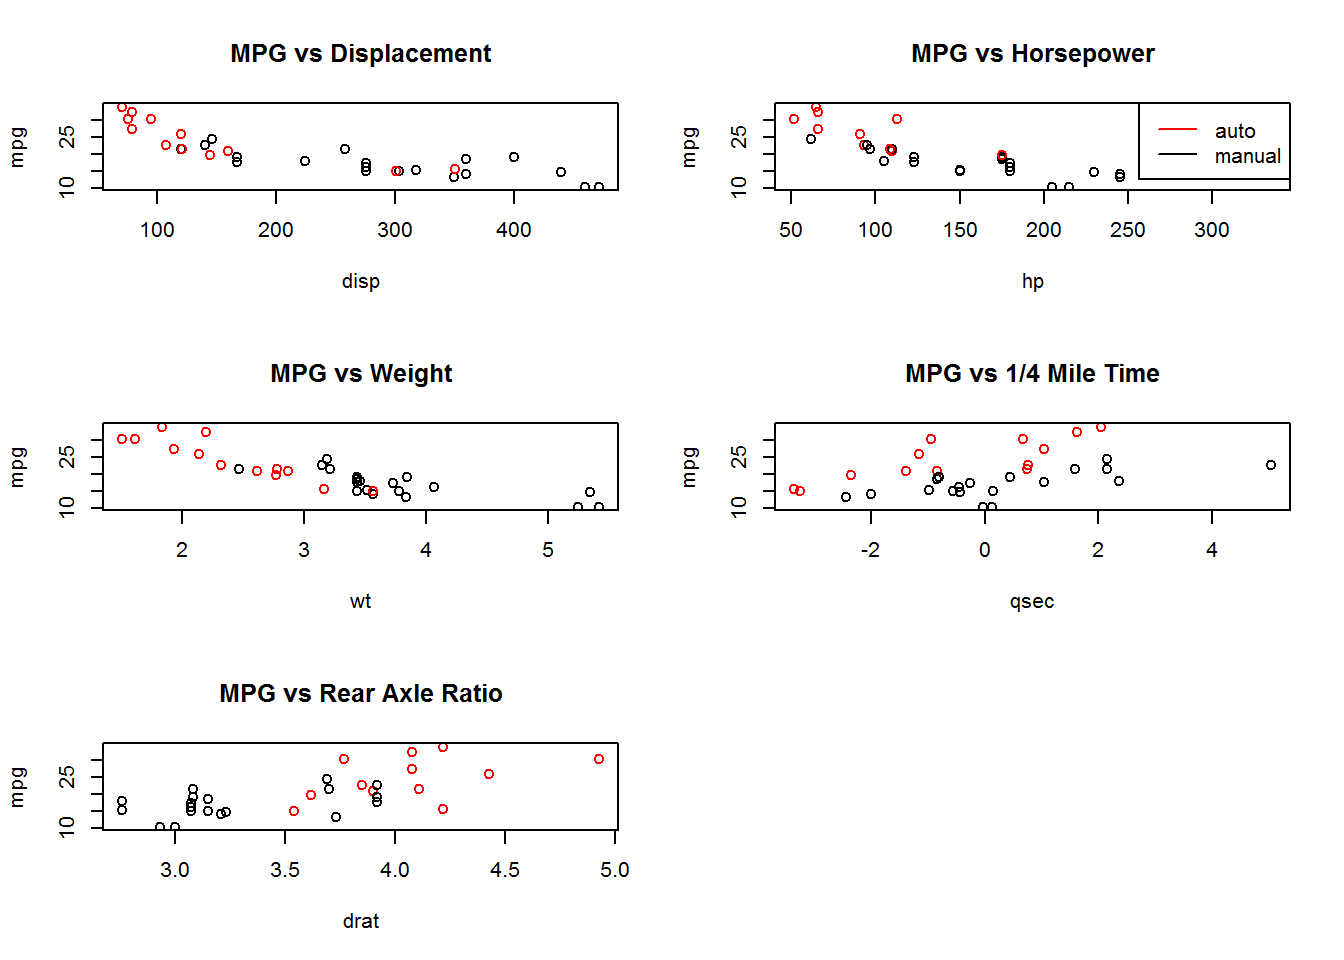
Figure 3: MPG vs Non-Categorical Variables
There seems to be associations between mpg and displacement, horsepower and weight. Interestingly automatic transmission now seems to be associated with the higher mpg. This demonstrates that conflicting patterns exist in mpg, particularly with transmission type. Identifying exactly which relationships are significant will be accomplished using regression analysis.
Regression Analysis
Model Selection
Since all categorical variables have been transformed into factors, they will be dummy-coded when used as a predictor in MLR. Since the interest is to check the effect of transmission type amf is included as the first predictor. Nested MLR fits are then generated with increasing model complexities first with non-categorical variables. ANOVA-F test is carried out:
fit0 <- lm(mpg ~ amf, data = mtcars)
fit1 <- update(fit0, mpg ~ amf + wtc)
fit2 <- update(fit1, mpg ~ amf + wtc + hpc)
fit3 <- update(fit2, mpg ~ amf + wtc + hpc + dratc)
fit4 <- update(fit3, mpg ~ amf + wtc + hpc + dratc + qsec)
fit5 <- update(fit4, mpg ~ amf + wtc + hpc + dratc + qsec + disp)

anova(fit0, fit1, fit2, fit3, fit4, fit5)
## Analysis of Variance Table
##
## Model 1: mpg ~ amf
## Model 2: mpg ~ amf + wtc
## Model 3: mpg ~ amf + wtc + hpc
## Model 4: mpg ~ amf + wtc + hpc + dratc
## Model 5: mpg ~ amf + wtc + hpc + dratc + qsec
## Model 6: mpg ~ amf + wtc + hpc + dratc + qsec + disp
## Res.Df RSS Df Sum of Sq F Pr(>F)
## 1 30 720.90
## 2 29 278.32 1 442.58 73.7170 6.325e-09 ***
## 3 28 180.29 1 98.03 16.3280 0.0004461 ***
## 4 27 176.96 1 3.33 0.5540 0.4636198
## 5 26 158.64 1 18.33 3.0525 0.0928895 .
## 6 25 150.09 1 8.55 1.4233 0.2440542
## ---
## Signif. codes: 0 '***' 0.001 '**' 0.01 '*' 0.05 '.' 0.1 ' ' 1According to the F-test statistics, weight and horsepower are relevant predictors in addition to transmission type while the rest are not. A similar process is done with categorical variables:
fit_1 <- update(fit0, mpg ~ amf + cylf)
fit_2 <- update(fit_1, mpg ~ amf + cylf + carbf)
fit_3 <- update(fit_2, mpg ~ amf + cylf + carbf + vsf)
fit_4 <- update(fit_3, mpg ~ amf + cylf + carbf + vsf + gearf)

anova(fit0, fit_1, fit_2, fit_3, fit_4)
## Analysis of Variance Table
##
## Model 1: mpg ~ amf
## Model 2: mpg ~ amf + cylf
## Model 3: mpg ~ amf + cylf + carbf
## Model 4: mpg ~ amf + cylf + carbf + vsf
## Model 5: mpg ~ amf + cylf + carbf + vsf + gearf
## Res.Df RSS Df Sum of Sq F Pr(>F)
## 1 30 720.90
## 2 28 264.50 2 456.40 24.6539 4.004e-06 ***
## 3 23 195.61 5 68.88 1.4884 0.2378
## 4 22 191.86 1 3.76 0.4057 0.5314
## 5 20 185.12 2 6.73 0.3636 0.6996
## ---
## Signif. codes: 0 '***' 0.001 '**' 0.01 '*' 0.05 '.' 0.1 ' ' 1Once again, F-test shows that the number of cylinders is important while the rest can be safely ignored. A final check is done for just the predictors we have selected so far, amf, cylf, wtc, and hpc:
## Analysis of Variance Table
##
## Model 1: mpg ~ amf
## Model 2: mpg ~ amf + cylf
## Model 3: mpg ~ amf + cylf + wtc
## Model 4: mpg ~ amf + cylf + wtc + hpc
##   Res.Df    RSS Df Sum of Sq       F    Pr(>F)
## 1     30 720.90
## 2     28 264.50  2    456.40 39.2861 1.388e-08 ***
## 3     27 182.97  1     81.53 14.0354 0.0009026 ***
## 4     26 151.03  1     31.94  5.4991 0.0269346 *
## ---
## Signif. codes:  0 '***' 0.001 '**' 0.01 '*' 0.05 '.' 0.1 ' ' 1
As the ANOVA F test indicates, all selected predictors (besides amf because it was never really checked except against the trivial model, the constant mean) are shown to be significant. The fit final3, with transmission type, number of cylinders, weight and horsepower as the predictors, is selected to be the final model for interpretation.
Residual Analysis
Figure 4 shows the residual plots.
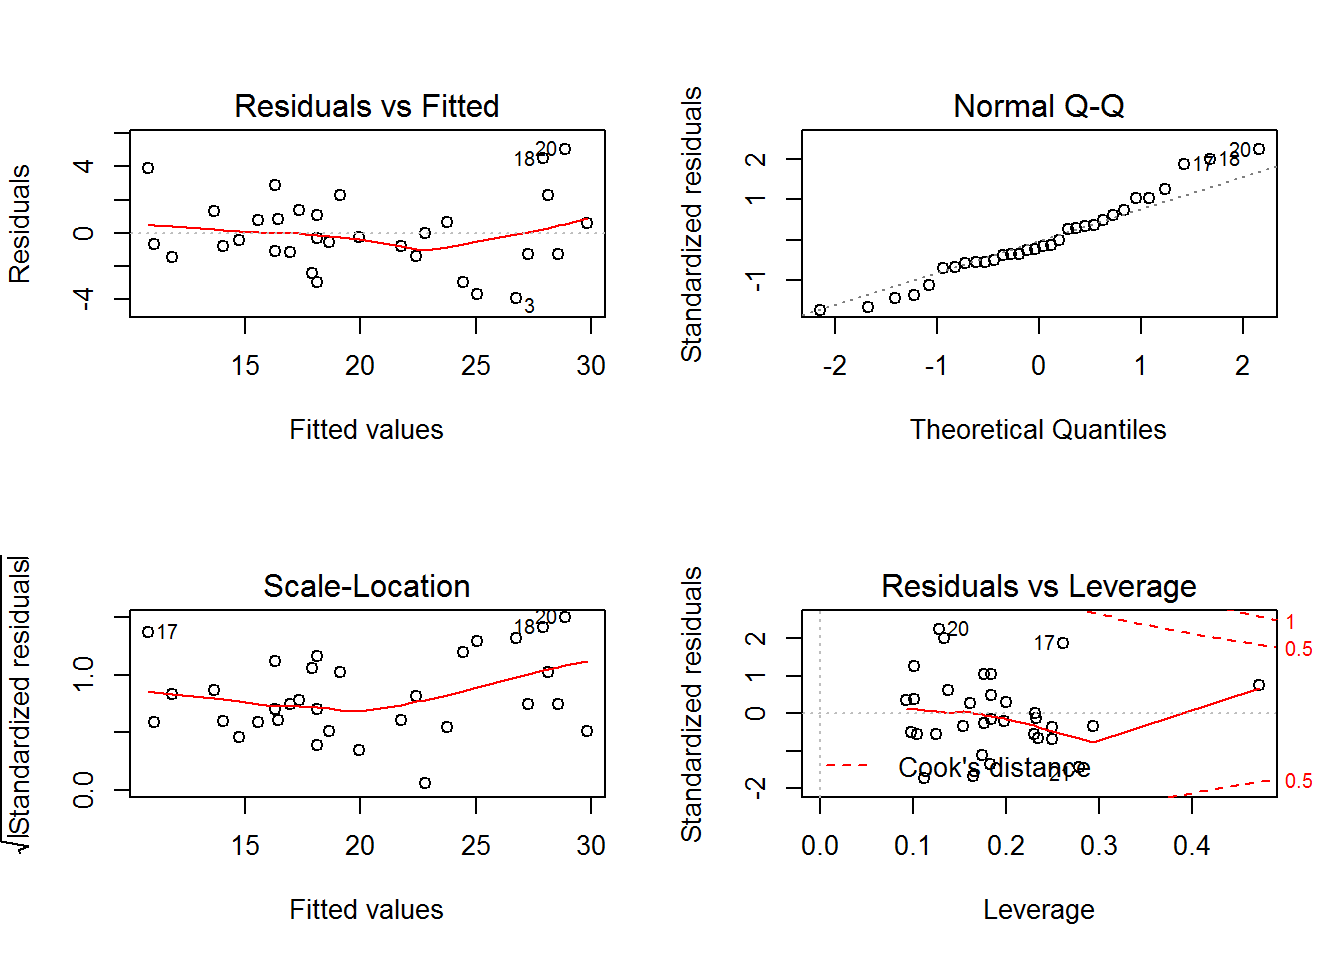
Figure 4: Residual Analysis
It can be seen that residuals vs fitted never deviate to more than 2 standard units away from 0. The QQ plot shows that the residual conforms to the normal distribution pretty well although at the far right side it seems to become a bit too wide. Scale-Location vs predictors plot shows a relatively horizontal line so the variance of residual is pretty constant (satisfies homoscedasticity) and finally the points that are furthest away from 0 have pretty low leverage so the fit should be fairly representative of the sample. Overall, the selection seems to be good.
Model Interpretation
The summary for the selected model is shown below.
##
## Call:
## lm(formula = mpg ~ amf + cylf + wtc + hpc, data = mtcars)
##
## Residuals:
##     Min      1Q  Median      3Q     Max
## -3.9387 -1.2560 -0.4013  1.1253  5.0513
##
## Coefficients:
##             Estimate Std. Error t value Pr(>|t|)
## (Intercept) 20.96535    1.56753  13.375 3.65e-13 ***
## amfmanual    1.80921    1.39630   1.296  0.20646
## cylf6       -3.03134    1.40728  -2.154  0.04068 *
## cylf8       -2.16368    2.28425  -0.947  0.35225
## wtc         -2.49683    0.88559  -2.819  0.00908 **
## hpc         -0.03211    0.01369  -2.345  0.02693 *
## ---
## Signif. codes:  0 '***' 0.001 '**' 0.01 '*' 0.05 '.' 0.1 ' ' 1
##
## Residual standard error: 2.41 on 26 degrees of freedom
## Multiple R-squared:  0.8659, Adjusted R-squared:  0.8401
## F-statistic: 33.57 on 5 and 26 DF,  p-value: 1.506e-10
The adjusted \(R^2\) value is 0.84, which means 84% of the sample MPG variance is explained by the MLR. The model coefficients can be interpreted as follows:
- (Intercept): a car can drive 20.97 miles per gallon if it is at the average sample weight and horsepower and uses automatic transmission with a 4-cylinder engine.
amfmanual: a car can drive 1.81 miles per gallon more if you switch from automatic transmission to manual while keeping everything else constant.cylf6: a car will drive 3.03 miles per gallon less if you switch from a 4-cylinder engine to a 6 cylinder engine while keeping everything else constant.cylf8: a car will drive 2.16 miles per gallon less if you switch from a 4-cylinder engine to an 8 cylinder engine while keeping everything else constant.wtc: a car will drive 2.50 miles per gallon less if you increase its weight by 1000 lbs while keeping everything else constant.hpc: a car will drive 0.03 miles per gallon less if you increase its engine horsepower by 1 hp while keeping everything else constant.
It should be noted that the P values for amfmanual and cylf8 are larger than the traditional cutoff value of 0.05. This means they are not statistically significant. Thus the null hypothesis (\(\beta_i = 0\)) for these coefficients cannot be rejected and it must be concluded that they do not have significant effects on MPG.
Conclusion
Using MLR analysis a model is constructed to reflect the association of fuel efficiency, mpg with transmission type, number of cylinders, horsepower and weight. Residual analysis shows that the model is a good fit. Interestingly, T-test on the model coefficients reveals that the null hypothesis for the transmission type and 8-cylinder engine coefficients cannot be rejected. The evidence therefore suggests that switching the transmission from automatic to manual or the number of cylinders in the engine is increased from 4 to 8 does not have statistically significant effect on fuel efficiency despite what one may conclude based purely on first glance on boxplots such as those in Figure 1 and 2. Fuel efficiency seems to depend more significantly on weight and horsepower.
Digression
- The fact that cylf8 is insignificant is counter intuitive as cylf6 seems to have a significant effect on fuel efficiency. Coefficient for cylf8 is also more positive than that of cylf6, suggesting that increasing cylinder number past 6 may actually increase fuel efficiency relative to a 6-cylinder car. Without consulting with an automobile engineer one cannot say with certainty if that is reasonable. If it is not then this may be a sign that there are problems with the data collected for 8 cylinder cars.
- As with all things manual, the competence of the driver is a huge factor that should be considered. It is reasonable to believe that a terrible driver not accustomed to driving a manual transmission car will cause suboptimal fuel efficiency. Since the data does not contain any metrics for competency it is assumed that all data is collected under optimal performance.