The Effects of Vitamin C Supplements on Guinea Pig Odontoblast Lengths
Synopsis
Teeth length data are extracted from the ToothGrowth dataset. Utilizing bootstrap and one-sided tests, multiple hypothesis are tested. The result indicates that the highest dosage, 2 mg/day gives the most significant increase to teeth length in guinea pigs. Also in general, orange juice is more effective than ascorbic acid. However, both supplements are about equally effective at the highest dosage tested.
1. Introduction
This is an expansion of a project I did for the Statistical Inference course certificate on Coursera by Johns Hopkins University. Groups of guinea pigs were administered various dosages of vitamin C through either orange juice or ascorbic acid. The lengths of odontoblast cells were then measured (Crampton 1947). This report analyzes the data to determine the effects of the dosage and delivery method using value difference tests.
2. Data Summary
ToothGrowth is a built-in R dataset. According to the R documentation, ToothGrowth is a data frame containing the following variables:
- len (numeric): Tooth length of guinea pigs.
- supp (factor): Supplement type (VC for ascorbic acid or OJ for orange juice).
- dose (numeric): Dose in milligrams/day (0.5, 1, or 2).
each containing 60 observations. The first couple of data entries can be seen below:
##    len supp dose
## 1  4.2   VC  0.5
## 2 11.5   VC  0.5
## 3  7.3   VC  0.5
## 4  5.8   VC  0.5
## 5  6.4   VC  0.5
## 6 10.0   VC  0.5
Without additional information, it is reasonable to assume that the guinea pigs are independent of each other and the supplement type/dosage given are randomly assigned with no bias.
3. Exploratory Analysis
The data is first factored into six groups for each supplement type and each dosage. Each observation group is referred to by supplement type followed by dosage. For example, ascorbic acid delivered at 2 mg/day is referred to as VC 2. The mean tooth length under each supplement types and each dosage is shown in 1.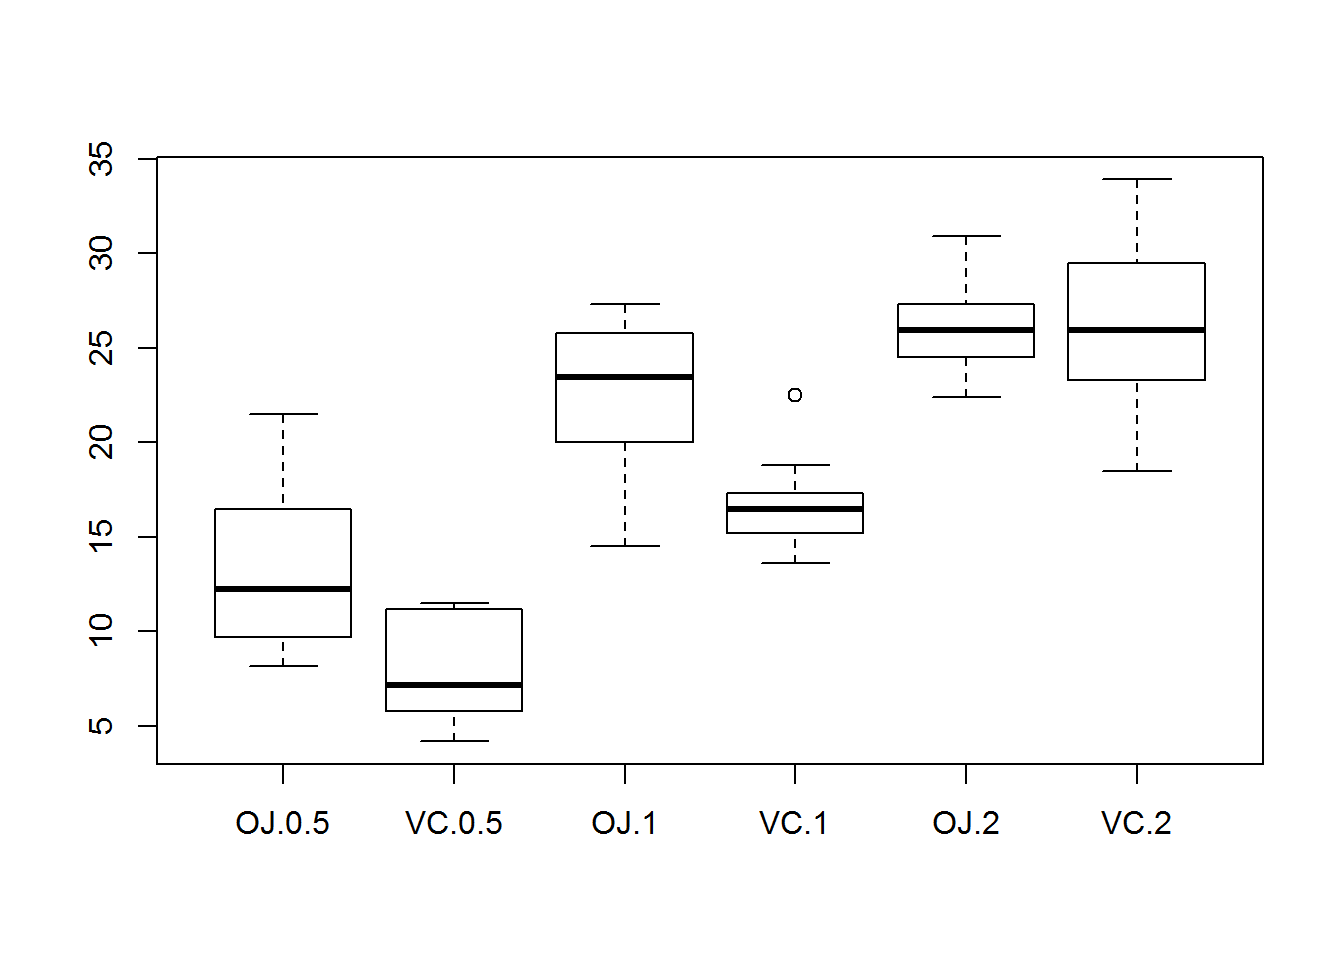
Figure 1: Lengths by Type and Dosage
Notice that the medians deviate from the middle for some of the groups. Also, each group with the a specific supplement type and dosage has a fairly small sample size (10). It is important to test the normality of the data before committing to a test that requires a normal distribution. Distribution for each supplement and dosage is shown in 2.
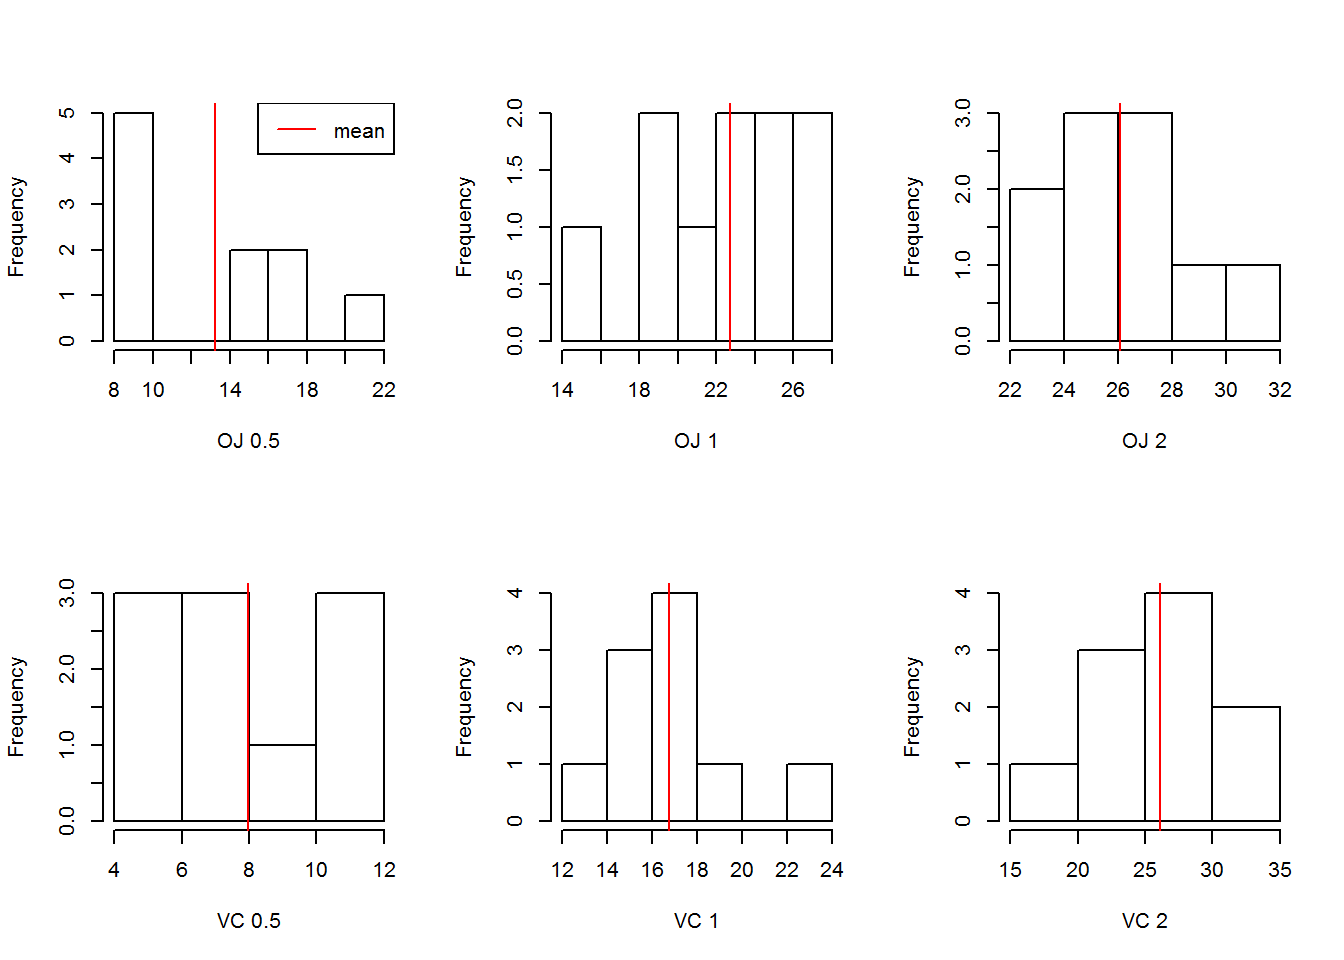
Figure 2: Sample Distributions
It is clear that for some groups the distributions are not normal. This is possibly due to the small sample size. Since most hypothesis tests require normal distributions for the samples, an empirical bootstrap is used to alleviate the problem.
3.1 Bootstrap
Each group is resampled with replacement to create 1000 samples of 10 members. The sample means are then calculated. This creates a bootstrapped sample mean distribution from 1000 means of each group. The code used is displayed below.
# set random number generator seed for reproducibility
set.seed(1234)

bootstrap <- function(supp_str, dose, n_samp) {

    data <- group_extract(supp_str, dose)

    resampled <- replicate(n_samp, mean(sample(data, replace = TRUE)))

    return(resampled)
}
4. Hypothesis Test
With the bootstrapped data it is possible to make two-sampled tests between different groups without any assumption of the sample distributions. A function to generate the p-value of a one-sided “greater than” hypothesis test using two bootstrapped sample statistics distributions is shown belown:
# Test if mean of sample 1 is greather than mean of sample 2 using bootstrap
#
# ARGS:
# bs1, bs2: empirically bootstrapped sample means for group 1 and group 2
#
# Returns p-value for alt: mean bs1 > mean bs2
two_sample_bootstrap <- function(bs1, bs2) {

    mean_diff <- bs1 - bs2

    avg_diff <- mean(mean_diff)

    mean_diff_centered <- bs1 - bs2 - avg_diff

    p_val <- length(mean_diff_centered[mean_diff_centered > avg_diff])/
        length(mean_diff_centered)

    return(p_val)
}
4.1 Effect of Dosage
It may be of interest to limit the deciding factor to just the dosage. In this case the groups are only differentiated by the dosage factor. The following hypothesis is formed:
\[H_0: \bar{X}_{2} - \bar{X}_{1} = \bar{X}_{2} - \bar{X}_{0.5} = \bar{X}_{1} - \bar{X}_{0.5} = 0 \] \[H_A: \bar{X}_{2} > \bar{X}_{1}, \bar{X}_{2} > \bar{X}_{0.5}, \bar{X}_{1} > \bar{X}_{0.5}\] In other words, the null hypothesis is that dosage has no significant effect on odontoblast lengths. The alternative hypothesis is that 2mg/day results in the greatest average length while 0.5mg/day results in the shortest average length. One-sided two-sample bootstrap tests are carried out to check if 2 mg/day average is greater than other groups. The p-values are listed below:
##   (X2 > X1) (X2 > X0.5) (X1 > X0.5)
##           0           0           0
With such small p-values it is safe to reject the null hypothesis. Therefore the alternative hypothesis, that is 2mg/day of vitamin C produces longer lengths than both 1mg/day and 0.5mg/day and 1mg/day produces longer lengths than 0.5mg/day, can be accepted.
4.2 Effect of Supplement Type
The supplement type is now used as the sole grouping factor. The hypothesis to be tested is:
\[H_0: \bar{X}_{OJ} - \bar{X}_{VC} = 0\] \[H_A: \bar{X}_{OJ} > \bar{X}_{VC}\]
In other words, the alternative hypothesis is giving orange juice is more effective at increasing teeth length compared to giving ascorbic acid. The computed p-value is 0.029. Since it is once again smaller than the traditional cutoff value at 0.05, the null hypothesis is rejected. Orange juice is found to increase teeth length more effectively compared to ascorbic acid in general.
4.3 All combinations
Finally both supplement type and dosage are used to define the groups. The following hypothesis is tested first
\[H_0: \bar{X}_{VC 2} - \bar{X}_{OJ 0.5} = 0\] \[H_A: \bar{X}_{VC 2} - \bar{X}_{OJ 0.5} > 0\]
In other words, the null hypothesis is there is no significant mean difference in teeth length between VC 2 and OJ 0.5. The alternative hypothesis is VC 2 produces significantly longer teeth lengths compared to OJ 0.5 on average. The p-value for the hypothesis test above is 0. Since it is less than the customery cutoff p = 0.05 the null hypothesis is rejected. VC 2 produces significantly longer teeth on average compared to OJ 0.5.
The same process can be repeated multiple times with other groups to produce the following table:
| OJ_0.5 | VC_1 | OJ_2 | VC_0.5 | OJ_1 | VC_2 | |
|---|---|---|---|---|---|---|
| OJ_0.5 | NA | 0.994 | 1.000 | 0.002 | 1.000 | 1.000 |
| VC_1 | 0.006 | NA | 1.000 | 0.000 | 1.000 | 1.000 |
| OJ_2 | 0.000 | 0.000 | NA | 0.000 | 0.021 | 0.504 |
| VC_0.5 | 0.998 | 1.000 | 1.000 | NA | 1.000 | 1.000 |
| OJ_1 | 0.000 | 0.000 | 0.979 | 0.000 | NA | 0.957 |
| VC_2 | 0.000 | 0.000 | 0.496 | 0.000 | 0.043 | NA |
This table has to be read as The P value for the alternative hypothesis (row name) > (column name). The following alternative hypothesis should therefore be accepted for making the cutoff at P = 0.05:
## [1] OJ_0.5 > VC_0.5, P-val = 0.002
## [1] VC_1 > OJ_0.5, P-val = 0.006
## [1] VC_1 > VC_0.5, P-val = 0
## [1] OJ_2 > OJ_0.5, P-val = 0
## [1] OJ_2 > VC_1, P-val = 0
## [1] OJ_2 > VC_0.5, P-val = 0
## [1] OJ_2 > OJ_1, P-val = 0.021
## [1] OJ_1 > OJ_0.5, P-val = 0
## [1] OJ_1 > VC_1, P-val = 0
## [1] OJ_1 > VC_0.5, P-val = 0
## [1] VC_2 > OJ_0.5, P-val = 0
## [1] VC_2 > VC_1, P-val = 0
## [1] VC_2 > VC_0.5, P-val = 0
## [1] VC_2 > OJ_1, P-val = 0.043
Almost everything in this table agrees with the assessment so far from analyzing the effect of dosage and supplement type. However, notice that a break in pattern occurs when the hypothesis test fails to reject the null for VC 2 > OJ 2 and OJ 2 > VC 2. This means for the 2mg/day case the lengths resulted from different supplement types are not signifcantly different from each other.
5. Conclusion
Combinging the analysis done for the effect of dosage and supplement type, it is clear that higher dosages of vitamin C results in longer odontoblast lengths and orange juice in general is more effective at producing longer lengths compared to ascorbic acid. However, comparison between all possible combination shows that the higher effectiveness of orange juice is only significant at dosages equal or lower than 1 mg/day.
References
Crampton, E. W. 1947. “The Growth of the Odontoblast of the Incisor Teeth as a Criterion of Vitamin C Intake of the Guinea Pig.” The Jounal of Nutrition 33 (5). American Society for Nutrition: 491–504. http://jn.nutrition.org/content/33/5/491.full.pdf.